Big Data Analytics Tools: What to Use and When
I'm an AI and Quality Engineering Lead at HBLAB, Vietnam's trusted partner for transforming enterprises with modern technology.
After 8 years building quality systems for Fortune 500 companies, I've realized something: legacy systems aren't bad—they're just old. The magic happens when you give them superpowers.
At HBLAB, I lead initiatives that blend cutting-edge AI with practical engineering discipline. We've helped 600+ enterprises modernize their applications, reduce costs, and actually enjoy their infrastructure.
What gets me excited: • Turning "this will take 2 years" into "this will take 3 months" • Making AI accessibility for enterprises (not just startups) • Building teams that care about quality AND velocity • Modernization stories that actually save millions
I write about digital transformation, the business case for technical investment, and the human side of technology change. Because at the end of the day, great technology is about enabling people, not just impressive code.
Let's talk about making your enterprise software better.
If you talk to ten data teams about “big data analytics,” you’ll probably hear ten different tool names. Hadoop, Spark, Kafka, TensorFlow, Snowflake, Power BI…
Most modern big data stacks are built from the same few layers that work together:
How you store and manage the data
How you process and compute over that data
How you analyze, model, and apply AI
How you visualize and share the results
This post walks through those layers and how teams actually use them in production.
1. Data Storage and Management: Where All the Data Lives
Think of storage as the “warehouse and shelves” of your data operation. If this part is wrong, everything on top becomes painful.
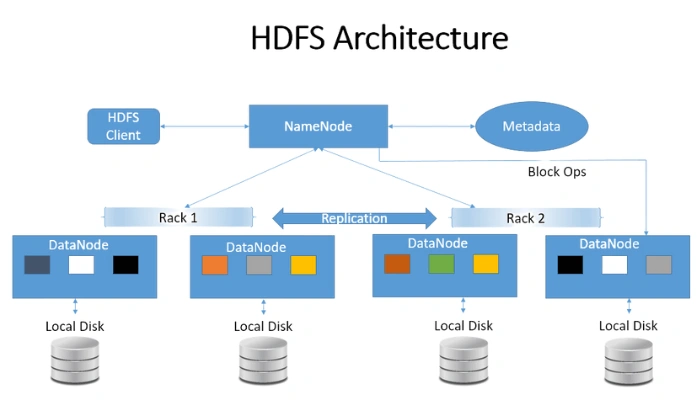
Hadoop & HDFS: The backbone
Hadoop and its Hadoop Distributed File System (HDFS) were the first widely adopted way to store huge amounts of data cheaply across many machines. Instead of buying one very expensive server, companies could spread petabytes of data across hundreds or thousands of “ordinary” servers.
Real‑world pattern: log and clickstream storage
Imagine an e‑commerce company:
Every time a user visits a page, clicks “add to cart,” or searches, that event is logged.
Over a few months, this becomes terabytes of semi‑structured data (JSON logs).
Storing all of that in a traditional relational database becomes slow and extremely expensive.
HDFS shines here:
Logs are written as files into HDFS.
Files are replicated across multiple machines, so if one node dies, no data is lost.
Later, processing engines like Spark can read those files in parallel.
Today, more teams are shifting this same idea to cloud object storage (e.g., Amazon S3, Azure Blob Storage, Google Cloud Storage). Conceptually, it plays a similar role to HDFS, but with elastic, managed infrastructure.
Cloud object storage and data lakes / lakehouses
In the cloud, most large organizations maintain a data lake: a central bucket of all raw data—CSV, JSON, Parquet, logs, images, etc.
On top of that, newer “lakehouse” technologies (like Databricks, Apache Iceberg, Apache Hudi, Delta Lake) try to combine the best of data lakes and data warehouses:
From lakes: Cheap, flexible storage of all kinds of data
From warehouses: Transactions, schemas, governance, and fast SQL queries
Example: marketing analytics lakehouse
A marketing team might feed:
Ad platform exports (Meta, Google Ads)
Website events (from tools like Segment or homegrown trackers)
CRM data (Salesforce, HubSpot)
into a data lake on S3. A lakehouse layer (e.g., Delta Lake) adds:
Versioned tables (you can “time travel” to last week’s state)
Schema evolution (you can add new columns safely)
ACID transactions (multiple jobs can update data without corruption)
This turns a messy bucket of files into structured tables analysts can actually trust.
NoSQL databases: Flexible and fast for certain workloads
NoSQL databases are built to handle:
Flexible or evolving schemas
High write/read throughput
Large volumes of semi‑structured data
Different types include:
Document stores (MongoDB, Couchbase)
Key‑value stores (Redis, DynamoDB)
Wide‑column stores (Cassandra, HBase)
Example: real‑time personalization
An online retailer wants to show personalized recommendations on the homepage within milliseconds:
User profiles and recent behavior events are stored in a NoSQL database (e.g., Cassandra or DynamoDB).
Each web request fetches the user’s latest profile as a document (JSON) and feeds it into a recommendation model.
The system can handle thousands of concurrent reads/writes without falling over.
This is not a data warehouse job—it needs low latency and flexible documents, which is where NoSQL fits.
Data warehouses and lakehouses for analytics
Tools like Snowflake, BigQuery, Amazon Redshift, Azure Synapse live here. They’re designed for analytical queries, not day‑to‑day transactions like banking systems.
Typical workloads:
“What was revenue per region last quarter?”
“How many users clicked on a campaign and then purchased within 7 days?”
“What is the churn rate by subscription plan?”
These platforms store data in columnar format and use massively parallel processing (MPP), which makes aggregations and joins over billions of rows surprisingly fast—often seconds rather than hours.
Practical pattern: ETL/ELT with a warehouse
A simple data pipeline might look like:
Raw data lands in cloud storage (your data lake).
A scheduled job (dbt, Spark, or built‑in tools) cleans and transforms this data.
Clean, business‑friendly tables live in a warehouse (e.g.,
fact_orders,dim_customers).BI tools like Power BI or Tableau connect directly to the warehouse.
This is where non‑technical stakeholders begin to trust the numbers—because the warehouse is treated as a controlled, curated source of truth.
2. Data Processing and Computation Engines
Apache Spark: The go‑to engine for big data
Apache Spark is the de‑facto standard engine for large‑scale data processing. It supports:
Batch processing (big, scheduled jobs)
Streaming (continuous, near real‑time processing)
Machine learning and graph processing
APIs in Python, Scala, SQL, and R
Concrete example: daily sales aggregation with PySpark
Suppose a retailer gets raw order events as JSON in cloud storage. A typical PySpark job might:
Read raw events in parallel
Parse JSON and extract fields (order_id, user_id, timestamp, amount, region, etc.)
Filter out invalid records
Aggregate metrics by region and day
Write the result as a table or Parquet files for the warehouse
Conceptually:
pythonfrom pyspark.sql import SparkSession
from pyspark.sql.functions import col, sum as spark_sum, to_date

spark = SparkSession.builder.appName("daily_sales").getOrCreate()

raw_df = spark.read.json("s3://company-raw/orders/*.json")

clean_df = raw_df.filter(col("amount").isNotNull())

daily_sales = (clean_df
    .withColumn("order_date", to_date(col("timestamp")))
    .groupBy("region", "order_date")
    .agg(spark_sum("amount").alias("total_sales")))

daily_sales.write.mode("overwrite").parquet("s3://company-analytics/daily_sales/")
Apache Flink and Kafka Streams: Real‑time, low‑latency processing
When you need results in seconds or milliseconds, batch is not enough.
Common pattern:
Events are written to Apache Kafka topics (e.g., “orders,” “pageviews,” “sensor_readings”).
Processing engines like Apache Flink or Kafka Streams consume these events and compute metrics on the fly.
Example: fraud detection on payment events
A payments company might:
Stream every card transaction into a Kafka topic.
Use Flink to maintain a sliding window of recent transactions per card.
Flag suspicious patterns in real time, like 10 transactions in 2 minutes from different countries.
Immediately trigger alerts or even block transactions.
Here, latency matters. The difference between 3 seconds and 3 minutes can be the difference between catching fraud and losing a lot of money.
MapReduce and YARN: The older foundation that’s still around
Before Spark, MapReduce was the standard Hadoop processing model, and YARN (Yet Another Resource Negotiator) managed cluster resources. Spark often runs on top of YARN in existing Hadoop ecosystems.
Many legacy pipelines still:
Use MapReduce for nightly batch jobs
Run Spark on YARN clusters for more modern workloads
If you join an older enterprise, it’s common to find both: Spark gradually taking over critical paths, while MapReduce jobs are slowly retired.
3. Analytics, Machine Learning, and AI: Turning Data into Intelligence
Once data is stored and processed, the next layer is about making sense of it—statistics, machine learning, and now more and more AI.
Python and R: The workhorses of data science
Most data science work happens in Python or R, often starting right in a notebook (Jupyter, VS Code, RStudio):
Python brings rich libraries:
pandas,numpy,scikit-learn,tensorflow,pytorch.R is strong in statistics, visualization, and academic/research environments.
Practical example: customer churn model
A subscription company might:
Use Spark or the warehouse to create a training dataset: one row per customer with features like last login date, number of support tickets, plan type, monthly spend, etc.
Export this table and load it into Python with
pandas.Train a scikit‑learn model (e.g., gradient boosting) to predict whether a customer is likely to cancel in the next 60 days.
Deploy the model so it can score customers daily and feed that into CRM tools for retention campaigns.
Even if the training step runs on a subset of data, prediction (inference) often runs at big data scale—scoring millions of customers every day.
TensorFlow, PyTorch, and scikit‑learn
scikit‑learn: Great for classical ML (regression, trees, clustering) and smaller to medium datasets.
TensorFlow and PyTorch: Power deep learning—recommendation systems, NLP, computer vision.
Example: recommendation engine on big data
A streaming service might:
Use Spark to prepare huge user‑item interaction matrices.
Train a deep learning recommendation model in PyTorch on GPU clusters.
Export the trained model and deploy it behind an API or into a streaming pipeline.
Use real‑time features from NoSQL databases and Kafka to serve context‑aware recommendations.
The “big data” part is not just storage; it’s training on billions of interactions to get better recommendations than a small‑sample model ever could.
Big data SQL engines
Not everyone wants—or needs—to write code. Big data platforms increasingly offer SQL interfaces that feel familiar to analysts:
Spark SQL
Presto / Trino
Hive
Query engines in Snowflake, BigQuery, Redshift, etc.
Example: analyst-friendly queries over massive tables
Instead of asking engineering to materialize a special report, a business analyst can:
Open a SQL editor connected to the warehouse or lakehouse.
Run a query like:
sqlSELECT
  region,
  COUNT(DISTINCT customer_id) AS active_customers,
  SUM(revenue) AS total_revenue
FROM
  fact_orders
WHERE
  order_date BETWEEN '2025-01-01' AND '2025-01-31'
GROUP BY
  region
ORDER BY
  total_revenue DESC;
Under the hood, this might be scanning billions of rows, but to the analyst, it just feels like fast SQL.
As AI features get integrated, platforms add things like “natural language to SQL” or automatic insights, so non‑technical users can ask, “Why did revenue drop last week?” and get a guided answer.
4. Visualization and Business Intelligence: Where People Actually See the Value
For most stakeholders, this is what “big data analytics” looks like: charts in a dashboard, KPIs on a TV screen in the office, or a report in their inbox.
Tableau, Power BI, Looker: Turning data into stories
Visualization tools help:
Connect to warehouses and data lakes
Build interactive dashboards (filters, drill‑downs)
Share insights with teams who never log into Spark or Python
Example: executive revenue dashboard
A typical dashboard might show:
Monthly revenue trend with targets
Top 10 regions and products by sales
Customer acquisition vs. churn over time
Conversion funnel (site visit → sign‑up → purchase)
Behind the scenes:
Data is cleaned and modeled in the warehouse (often using dbt).
A BI tool like Power BI connects to curated tables (e.g.,
mart_revenue,mart_funnel).Business users can slice by region, campaign, or sales channel without writing SQL.
The lesson many teams learn the hard way: If the BI layer is weak or untrusted, all the fancy big data tools underneath feel wasted. People need clear, consistent numbers and explanations.
Embedded analytics: Insights where work actually happens
Instead of sending people to a separate dashboard, many organizations now embed analytics directly into business applications:
A sales rep sees predicted churn and upsell opportunities inside the CRM.
A logistics manager sees real‑time delivery delays and risk scores in the routing tool.
A product manager sees feature usage analytics inside the internal admin UI.
This often involves:
A backend service querying the warehouse or a real‑time store.
A small API layer exposing pre‑computed metrics.
A front‑end component visualizing charts and tables.
From the user’s perspective, they’re not “doing analytics”—they’re just using a smarter application.
Putting It Together: A Simple End‑to‑End Big Data Stack
To make this less abstract, here’s a common, simplified pattern you’ll see in many companies:
Data ingestion
Events (clicks, orders, logins) flow into Kafka.
Batch data (CSVs from partners, daily exports) lands directly in cloud object storage.
Raw storage
- All ingested data lives in a data lake (S3 / Blob / GCS or HDFS).
Processing and modeling
Spark jobs clean and transform raw data into structured tables.
A lakehouse / warehouse (Snowflake, BigQuery, Databricks) holds curated analytical tables.
Machine learning & AI
Python notebooks pull training data from the warehouse.
Models are trained in scikit‑learn/TensorFlow/PyTorch.
Models are deployed and fed real‑time & batch features from the warehouse/NoSQL.
Analytics & visualization
Power BI/Tableau/Looker connect to curated tables for dashboards.
Some metrics are embedded into web apps or internal tools.
Each layer can be swapped (HDFS vs. S3, Spark vs. Flink, Tableau vs. Power BI), but the shape of the stack tends to look similar.
How to Choose Where to Start
For teams building or modernizing a big data stack, it helps to focus on problems, not tools. A few guidelines:
If you’re drowning in raw logs and files:
Invest first in a solid storage layer (cloud object storage + basic governance).
Add a warehouse or lakehouse to make that data queryable.
If reports are slow or unreliable:
Focus on your processing and modeling layer (Spark, dbt, or warehouse-native transforms).
Standardize metrics and models so everyone uses the same definitions.
If you need real‑time decisions:
Look at Kafka + Flink/Kafka Streams and a fast operational store (NoSQL).
Start with a single, high‑value use case like fraud detection or live personalization.
If business users are stuck waiting on engineers:
Prioritize a strong BI and self‑service analytics setup.
Give them well‑designed, documented tables and trustworthy dashboards.
Big data analytics is not about collecting every hot tool name on a slide. It’s about stitching together the right storage, processing, modeling, and visualization layers so that:
Data can grow without breaking systems.
Engineers can process and transform it efficiently.
Data scientists can build and deploy models with confidence.
Business users can see clear, reliable insights without needing to know what HDFS or Spark even are.
Get those layers working together, and the technology starts to feel less like “big data” and more like simply: the way your organization makes better decisions.


